
A lot of traders are frustrated with their losses.
It’s quite surprising because there are plenty of techniques to reducing the number of losing trades.
Some techniques are surprisingly easy and it all comes back to basics, to the foundation or the trading craft.
In this article I’m going to share some ideas that are really simple, very powerful, and can immediately help to avoid losing trades.
The Proven Formula
First, let’s start with the proven formula. This is a universal formula that can be used anywhere, in any market.
The formula is to “know your market”.
If you know your market, that makes it easier to follow the flow of money.

To follow the flow of money in your market, you need 2 major points. I call these points “The 2 Ts”, which stand for “Tendencies” and “Timing”.
For both of these Ts, each market is individual.
Each market has it’s own tendency and timing, and if you do just a very basic analysis of those 2 Ts, then you can immediately start improving your trading strategies and experiencing less losing trades.
A simple tool you can use today
I’m going to reveal a simple magic tool that I use for this kind of analysis.
This is a tool that everybody has access to, so I think we can label it a universal tool. What is it?
It’s an Excel spreadsheet!
That’s right – with all the sophisticated trading software we have available today, sometimes it’s best to go back to basics and do some good old fashion number crunching by hand (or by excel anyway)!
Through my analysis of Tendencies and Timing in Excel, I’m going to show you 3 very simple steps you can start implementing right away to reduce the number of losing trades.
#1 Using Directional Bias to avoid losing trades
The very first step when it comes to following the money is Directional Bias.
To determine the Directional Bias tendency, I do a simple simulation in Excel to see what would happen if:
1. I buy the open of each bar and then sell the close of each bar or
2. I sell short the open of each bar and then buy to cover at the end of the day.
If I do this simulation on 10 or 15 years of data, I have 3000-4000 trades, which is a very good sample size. I can derive lot of interesting insights from this basic data.
The very first thing I look at is the directional bias. You might be surprised how strong directional biases are not just in indexes, but in any other market.
For example, in the Russell 2000, if we have a look on daily data since 2007, we can see that the directional bias is towards the long side. If we buy every bar on the open and sell at the end of the day, we would make 0.15 points on average every day.
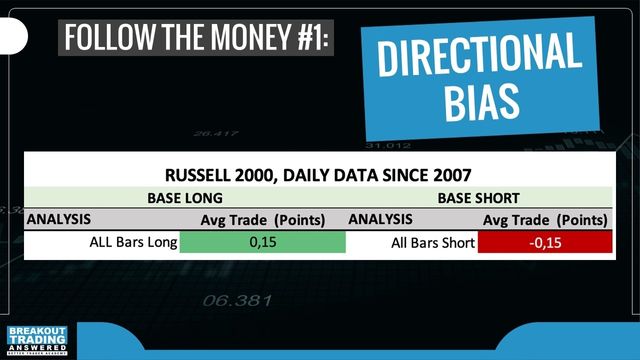
Now, this is not a strategy. We’re not considering any slippage or commissions. That’s not the point.
The point is the directional bias.
This is essential because if we do this analysis, we can very quickly find that some markets have directional biases so strong that just by trading with the directional bias, you can quickly mitigate a lot of false entries.
However, every market, including indexes, have periods where the regular bias might disappear.
With markets which are more neutral, these are the best markets because you can trade both sides. That’s the ideal state, you can trade them long and short. And that alone, the neutrality, already mitigates a lot of false entries.
But overall, if you have so many false entries, start with honouring the directional bias.
#2 How Time can reduce losing trades
Time is a very, very good pointer to improving your trading performance.
There are many ways to deploy time, but the easiest and often the strongest one is day of the week.
This is quite reliable with many markets. You can see in the example below, as I mentioned earlier, the average profit on the long side would be 0.15 points in Russell 2000:
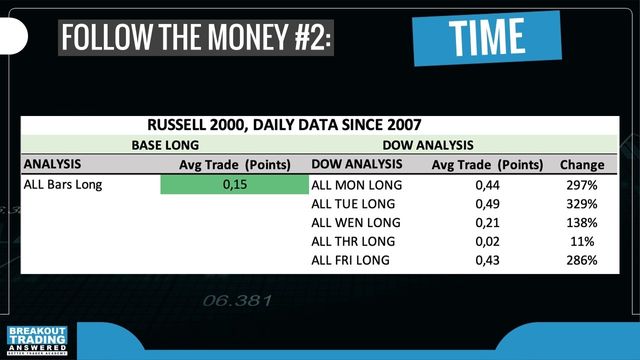
However, if you break that down into individual days of the week, you can see that trading on Tuesday is 300% higher than the average for all days.
By knowing the tendencies and timing in the market, and narrowing it down, you will find that some days of the week are very week and consistently lose money.
Certain markets have days which are heavily short days, and by excluding these heavily short days you can improve your false entries significantly.
#3 Using the Trend to avoid taking losing trades
This one really surprised me.
It’s nothing magical. It’s something very commonly used, especially in big institutions, which is the 100 and 200 period moving averages.
These are so much of a cliché that I ignored them for a long time. But recently I had a meeting in Luxembourg with some bankers because of our Hedge Fund and they were talking about how the 200-day moving average had crossed down, so we were officially in a bear market.
When I got back home, I did a test on these two moving averages on all the futures markets.
Guess what? It DOES have some significance.
I’m not saying it’s a magic bullet or a golden nugget, but there was more significance than I expected.
So, this is the third thing that can quite easily improve your timing. Just use one of these as a master filter to determine the overall market trend at that given moment.
It doesn’t have to necessarily be the 100- or 200-day moving average. It can be something else.
So what happens if we combine the directional bias with better timing, and the moving average Trend?
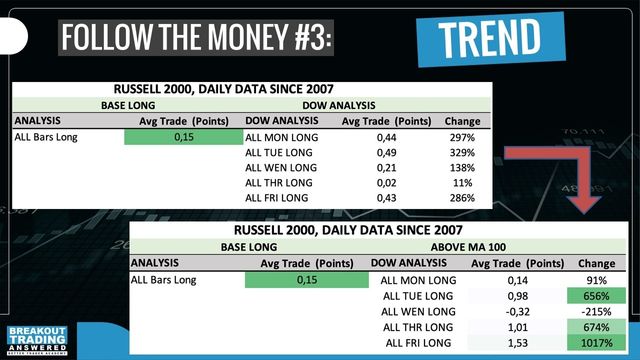
We can see that all of a sudden, the average trade jumps by 656% on Tuesday, and Friday it jumps up by a staggering 1017%.
So, these are the tendencies I’m always looking for in my Excel spreadsheet. Once we have this overview of tendencies, then we can start giving very clear pointers to our trading strategy of when to trade or when not to trade.
3 simple tips to avoid losing trades
These three tips are very quick to easy to implement.
If you have a strategy with too many losing trades, or with too many false entries:
1. Honour the market bias,
2. Consider the day of week timing,
3. Trade in the direction of the trend.
With these 3 tips, I guarantee you can start reducing your false entries pretty quickly and easily.
Extending this technique
This technique of analyzing data in Excel is a universal process.
It’s just up to your imagination what you want to track in your Excel spreadsheet, because we’ve just covered the most basic analysis in this article.
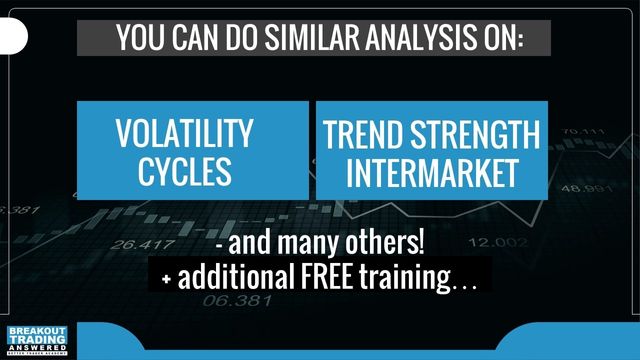
This analysis technique can be used for many other aspects of trading, like volatility, cycles, trend strength, intermarket relationships and more:
And by the way, when it comes to timing, I’ve developed a special timing called the “Timing Pyramid”.
It’s used to time your entries very, very precisely, and you can download a free ebook with this timing pyramid at https://smashingfalsebreakouts.com.
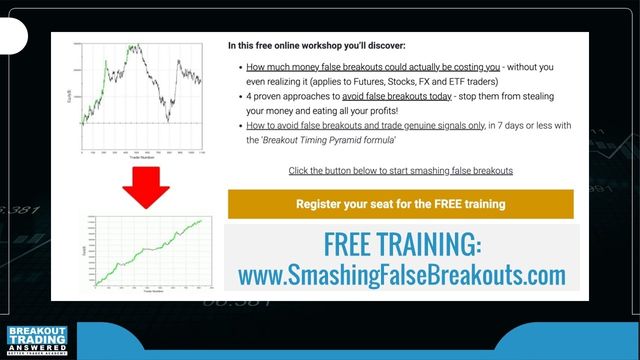
This example shown in the image above is a real-life example.
The image at the top is the strategy before, and then below you can see the strategy after applying the timing techniques from the timing pyramid.
You can get more details at: https://smashingfalsebreakouts.com
Watch the replay
Frustrated with taking too many losing trades? Here’s 3 simple tips you can use to avoid bad trades.
Algorithmic breakout trading specialists Tomas Nesnidal and Andrew Swanscott discuss “How To Avoid Taking Losing Trades”, including:
- The 2 T’s formula for less losing trades,
- The simple market analysis tool every trader can use,
- Identifying Directional Bias to reduce losing trades,
- How to deploy Timing to reduce false breakouts,
- Using Trend to identify when not to trade,
- Moving Average trend filters,
- Plus much more.
Episode Highlights:
[02:05] The formula for less losing trades
[04:35] The simple market analysis tool every trader can use
[05:40] Identifying Directional Bias to reduce losing trades
[12:28] How to deploy Timing to reduce false breakouts
[16:36] Using Trend to identify when not to trade
[21:30] Moving Averages for trend filters
[24:45] Using the process on volatility, cycles, trend strength
[29:00] Index Mastery month
Released: October 4, 2022