Would you like to see a car that can drive, fly and swim?
There’s something really cool about crazy ‘3-in-1’ solutions like this… :-)

Source: FORBES MAGAZINE JAN 2004
Forbes magazine wrote about such a car in the January 2004 issue.
It was a very ambitious project ran by Rinspeed, a Swiss design and engineering company.
The concept of the driving, flying and swimming car was called Splash. It was supposed to be introduced at the Geneva Motor Show.
Unfortunately, I’ve heard nothing about this exciting 3-in-1 concept car since the article was published, so we probably have to wait a bit longer to fulfill our James Bond-like dreams.
But there are still plenty of other cool ‘3-in-1’ solutions worth trying, and you can have one of them today.
This one is even a solution for traders!
It’s been tested and proven by trader Al (Alan).
It’s a ‘3-in-1’ solution that he first used to revive a dying trading strategy.
Then he used it to improve trading strategy robustness.
And lastly, he has used it to significantly boost trading performance, which is the last case study from Al that we’re going to share with you.
But first, let me remind you that this ‘3-in-1’ solution is called ‘Smashing False Breakouts’.
It’s a well researched, tested and prove solution.
It works on any market, for any trading style.
Want MORE? Sign up for the free BTA newsletter and join 1000’s of other traders who receive meaningful trading content every week, straight into your email inbox. Click here to join us.
It contains a set of 14 original and highly efficient techniques to improve your trading entries and it did true magic for Al (and many other traders too).
So, let’s get to Al’s 3rd case study.
First, Al deliberately took a very weak, untradable emini Dow Jones breakout trading strategy. This strategy is literally nothing to write home about, which makes it a perfect candidate to test the ‘Smashing False Breakouts’ techniques on.

This is the backtest summary report:
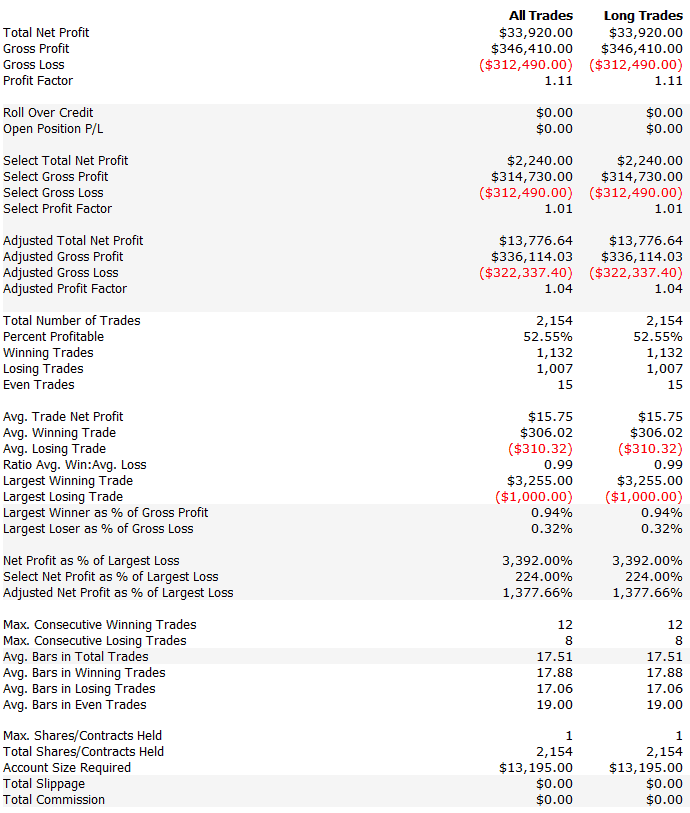
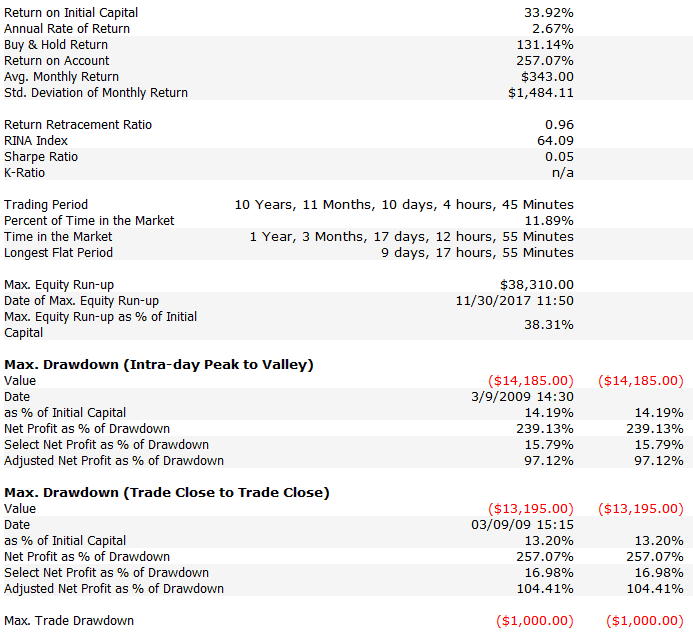
As you can see, the problem with this testing strategy is basically everything:
- The Average Trade is too small (15.75 USD),
- The drawdown is large (13,195 USD),
- And it has a horrible Net Profit / Max. Drawdown ratio (2.57).
Next, Al took all 14 ‘Smashing False Breakouts’ techniques and disassembled them into individual “occurrences”. (This is not really necessary however, Al was driven by deeper curiosity and wanted to test each “occurrence” individually).
What do I mean by “occurrences”?
For example, an entry signal can happen either above or below a certain Moving Average. These are two different occurrences, and each will have a different impact on the quality of your entries. (This is NOT an actual example from the ‘Smashing False Breakouts’ course, it is just an example for demonstration here).
When Al disassembled all 14 ‘Smashing False Breakouts’ techniques, he was left with a bit over 100 occurrences.
Then he tested each individually, with these results:
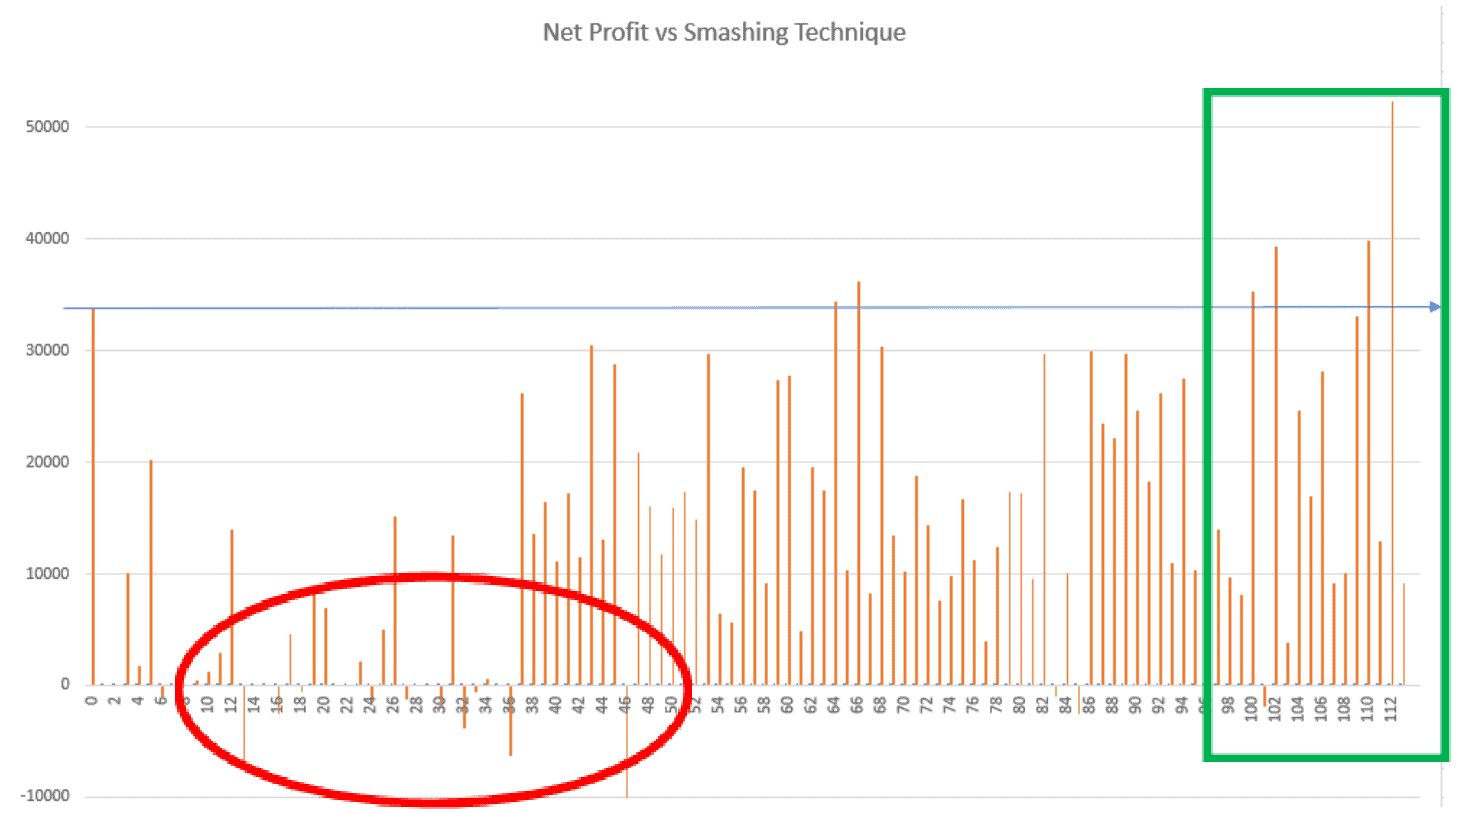
To explain this chart further:
The blue horizontal “baseline” shows the Net Profit of the original testing strategy. Each vertical bar represents the result of one occurrence. The most important are the negative value occurrences (13, 32, 36, etc). These are the occurrences that negatively impact the trading entries. Thus, NOT trading under these occurrences will help you to potentially avoid a lot of false entries.
And this is exactly what Al did next.
He started removing certain “dangerous” occurrences from his trading.
Just removing the first one (#13) improved the results significantly:
| Original | Smashing | Delta | |
| Net Profit: | $33,920 | $27,355 | -19.35 % |
| Trades: | 2,154 | 1,571 | -27.06% |
| Avg Trade: | $15.75 | $17.41 | +10.54% |
| Max C-to-C DD: | $13,195 | $6,295 | -53.23% |
| Net Profit/Max DD: | 2.57 | 4.35 | +69.26% |
Especially see how the Net Profit / Drawdown ratio was improved by +69.26% to much more acceptable levels.
But Al didn’t stop here.
As a next step, he started applying the ‘Dynamic Position Sizing’ approach in the ‘Smashing False Breakouts’ program. And he even combined some occurrences. (Because of the ‘Dynamic Position Sizing’ approach, he now tested the original strategy with 2 contracts, instead of one).
The result?
| Original (2 contracts) |
ALL 5 Rules | Delta | |
| Net Profit: | $67,840 | $61,570 | -9.24% |
| Trades: | 2,154 | 1,571 | -27.07% |
| Avg Trade: | $31.49 | $39.19 | +24.45% |
| Max C-to-C DD: | $26,390 | $11,165 | -57.04% |
| Net Profit/Max DD: | 2.57 | 5.51 | +114.40 |
All the key numbers improved.
Especially the Net Profit / Drawdown, which is one of the most important metrics to me, which improved by a staggering +114.40%.
Now, you may be wondering… is this just overfitting?
Al took a lot of care to ensure it wasn’t, and in his first case study, he shares how he did this. He also shares how the out-of-sample results closely matched the in-sample results.
Plus, in his second case study, he showed how the robustness was actually IMPROVED using these techniques.
So, there it is – a true 3-in-1 solution.
‘Smashing False Breakouts’ techniques can:
| 1. | revive a dying trading strategy, |
| 2. | improve robustness, and |
| 3. | boost overall trading performance. |
As Al shared in the previous case studies:
“The Smashing False Breakout Method really works!”

Thanks a lot for sending us all 3 case studies Al, and good work!
Happy trading,
Tomas and Andrew
Click on the link if you missed part 1 or part 2.
Stop False Breakouts from Destroying Your Trading Account
✓ How false breakouts are the biggest leak of money for breakout traders, including Futures, Stocks, FX and ETFs
✓ How much money false breakouts could actually be costing you – without you even realizing it
✓ A comprehensive deconstruction of timing – enter breakout trades at the right time and stop costly breakout trading mistakes
✓ 4 proven approaches to slashing false breakouts today – stop them from stealing your money and eating all your profits!


