Alan saves lives. He’s a doctor. A surgeon.
And now he’s decided to see if he can save dying trading strategies too.
Friends call him ‘Al’.
Al is one of our most passionate Breakout Strategies Masterclass students. He’s moving ahead with his trading at the speed of light. And he’s come up with an amazing way to improve the results of trading strategies…
Radically…
Which we’ll share with you in a minute…
But first, a bit more about Al.
Al lives in Michigan and he’s a very smart, results-driven guy.
But he works too much as a surgeon and wants to have more free time for his family.
That’s why he decided to pursue a new career as a fully automated trader.

Alan has already built a bunch of robust breakout trading strategies with the Breakout Strategies Masterclass.
But as a truly results-driven guy, he always aims for more.
So, as the next step, he decided to make his breakout trading strategies even better.
How?
By implementing the techniques from the ‘Smashing False Breakouts’ (SFB) program.
Want MORE? Sign up for the free BTA newsletter and join 1000’s of other traders who receive meaningful trading content every week, straight into your email inbox. Click here to join us.
But because Al is a smart guy, he first wanted to see if the Smashing False Breakouts (SFB) techniques actually work.
So, he decided to start with a most extreme test:
To take a completely failed strategy and see if it can be salvaged with the SFB techniques.
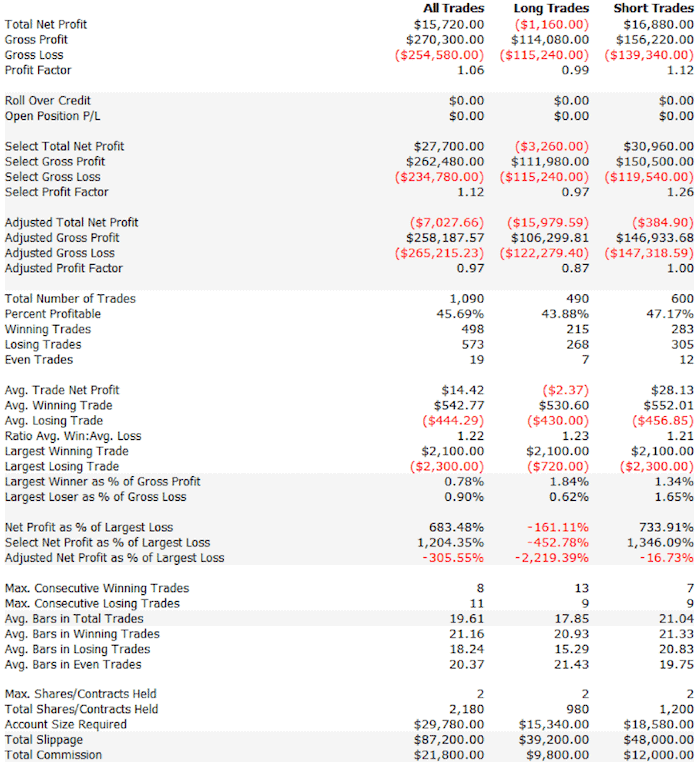
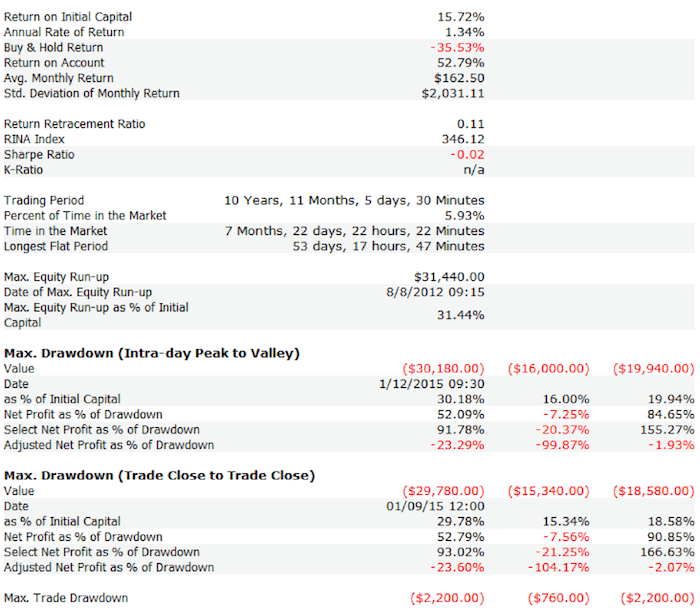
In his first test, Alan decided to use a very poor Lean Hogs breakout trading strategy. After applying $25 slippage and commission per contract the results looked like this. (Results are with 2 contracts position size):
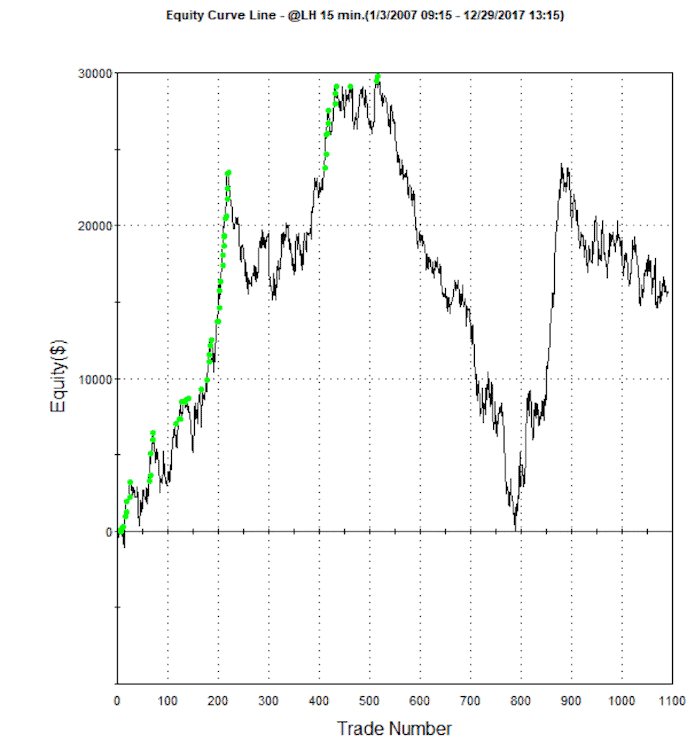
Of course, this is an untradable trading strategy.
The equity curve is truly terrible – nobody would trade a strategy like this.
In case you’re interested, here are the statistics from the backtest report:
As the next step, Al took all the techniques from the ‘Smashing False Breakouts’ program. (The ‘Smashing False Breakouts’ program shares proven, highly effective and innovative techniques to deal with false breakouts fast.)
Al took all 14 techniques from the program. Some of the techniques have multiple variants to test and some can also be tested on a different (higher) timeframe. Al decided to test all of the possible variants, which resulted in a little bit over 100 techniques. The beauty of that is with all the codes included in the SFB program, it didn’t actually take him too long.
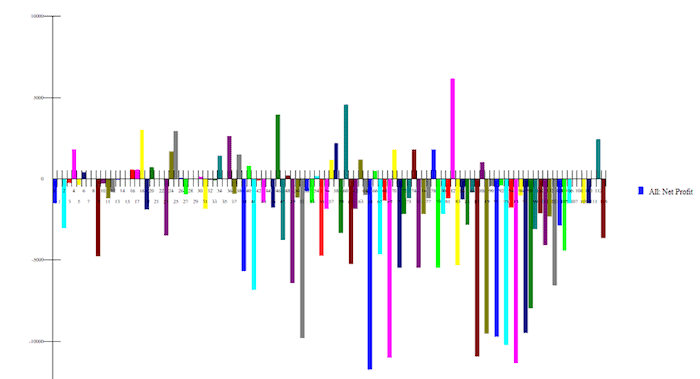
First, Al tested all the variants for Long positions. In general, the trading strategy loses money on the Long side, as you can see in the backtest report above. So, it’s no surprise that just a few of the techniques could turn the losing Long side into a profitable one. Still, there were quite a few (each vertical bar represents one tested SFB variant):
Long Positions
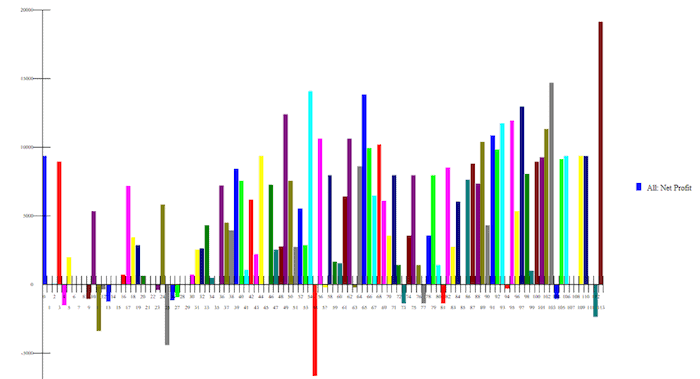
Then he repeated the same process for the Short positions:
Short Positions
Finally, Al applied SFB filters and revived the failing trading strategy.
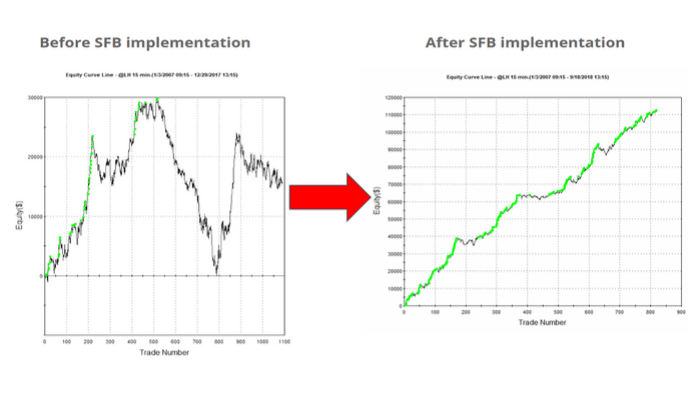
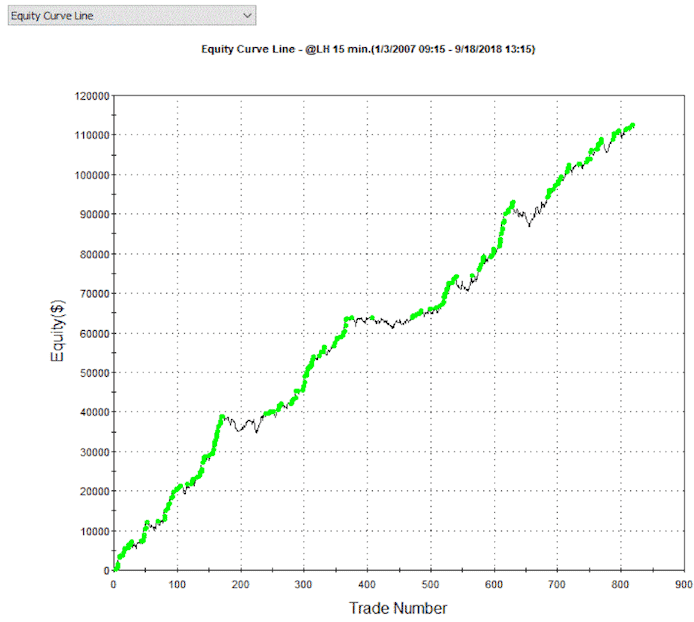
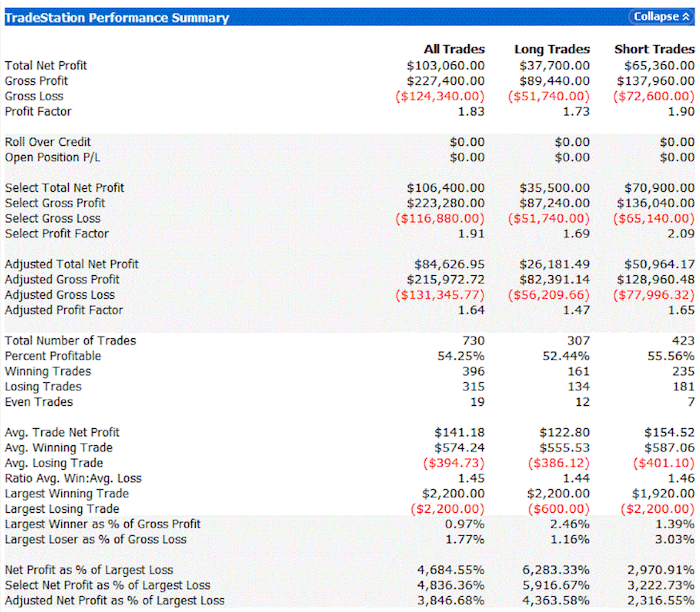
Plus, he added the ‘dynamic position sizing’ method we share in the ‘Smashing False Breakouts’ program, and these are the results after applying the SFB techniques:
So what can we learn from this?
It’s all about the results.
Risking less, but making more.
Delivering a smoother equity curve, but not overworking to accomplish it.
And it’s also about having the right tools.
Tools that will get you there faster than ever.
Tools that are easy to apply.
And tools that have been proven to actually work.
In Al’s words, here is the lesson he learned from his test:
“The Smashing False Breakout Method really works! Separating the system into Long and Short trades to identify the worst case (eliminate it) and best case (trade more contracts) enhances performance without necessarily curve-fitting the system. [It also means that Monte Carlo plots of Long-Only and Short-Only trades could potentially identify much earlier when a system is breaking down]. The daily market regime (Bull/Bear, Volatile/Quiet) [Data2] has a potentially HUGE impact on intra-day trading system results.“
Now, you may be thinking…
Is this just curve-fit garbage?
To answer your question, let’s continue with a comment from Al:
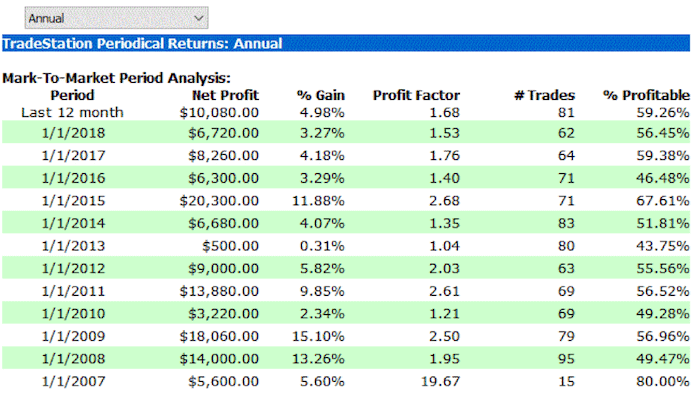
“After selecting these various filters, have we curve fit the system or is it still robust? To address this answer, I withheld the year 2018 from the original data set and tested the final system on this unseen data. You can see that the system continues to show an equity curve that maintains the same slope and is making consistently profitable trades into September 2018. The average trade has increased to $141 and the equity curve no longer has a deep dip.
Thank you, Tomas, for the Breakout Trading Masterclass and Smashing False Breakouts Courses!”
So, you can see:
| 1. | The ‘Smashing False Breakouts’ techniques can also be used to salvage failed strategies, |
| 2. | The techniques can be applied without curve fitting. |
But it gets even better.
With these techniques, you can even improve the robustness of your trading strategies.
Which is going to be subject of the next post where we share Al’s next study, so watch out for that in a few days time.
Meanwhile – amazing job, Al!
And thank you for sharing.
Tomas and Andrew
P.S.
For cynics – yes, Al is a real person. We even plan to record a podcast episode with Al very soon so keep your eyes (and ears) out for that one.
Stop False Breakouts from Destroying Your Trading Account
✓ How false breakouts are the biggest leak of money for breakout traders, including Futures, Stocks, FX and ETFs
✓ How much money false breakouts could actually be costing you – without you even realizing it
✓ A comprehensive deconstruction of timing – enter breakout trades at the right time and stop costly breakout trading mistakes
✓ 4 proven approaches to slashing false breakouts today – stop them from stealing your money and eating all your profits!

