Failed trading strategies are the number 1 killer of trading accounts.
That’s right – killer number 1!
And they can’t be avoided…
Failed trading strategies are just a part of trading, so if we don’t know how to manage failed strategies it can destroy our trading account, kill our confidence, and potentially end our dreams of becoming a successful trader.
So, what can we do about it?
What causes a trading strategy to fail?
And how can we detect strategy failure and stop it from destroying our trading account before it’s too late?
First, let’s define exactly what we mean with an example.
What is a failed trading strategy?
To make it clear, when we talk about failed strategies, this is what we’re talking about…
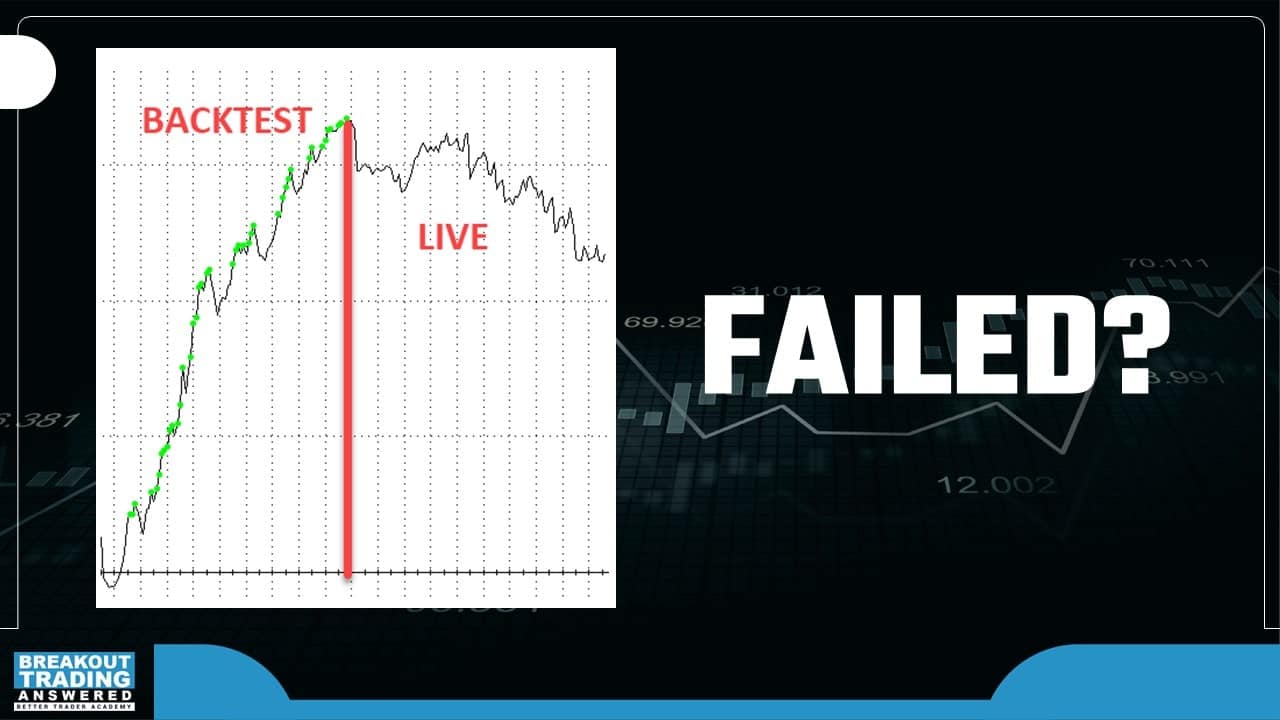
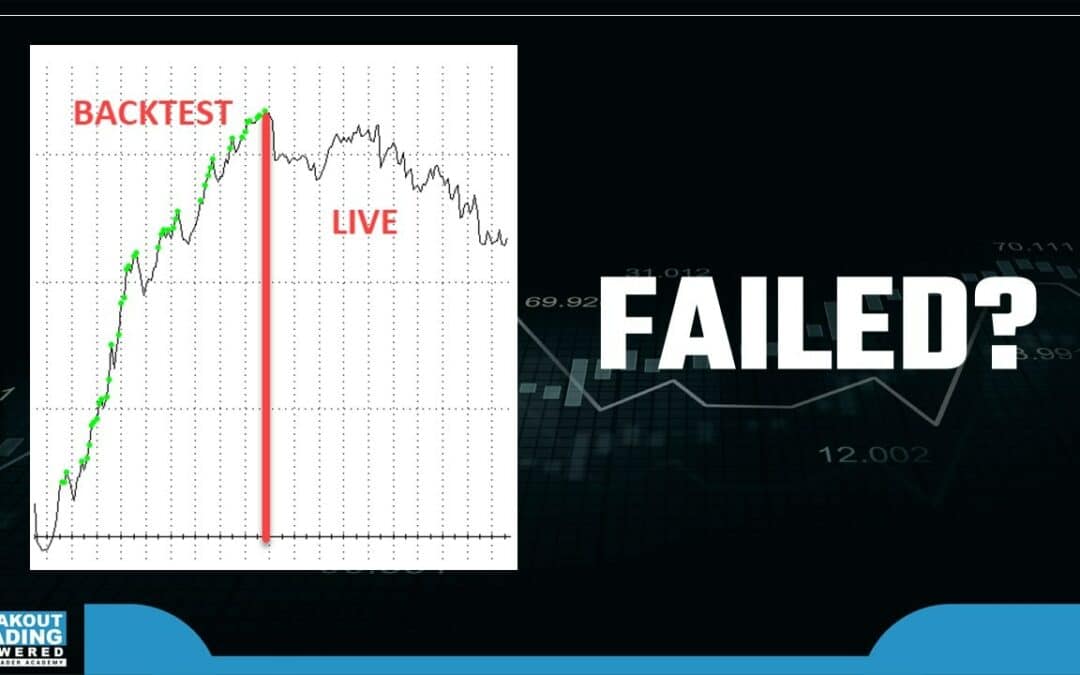
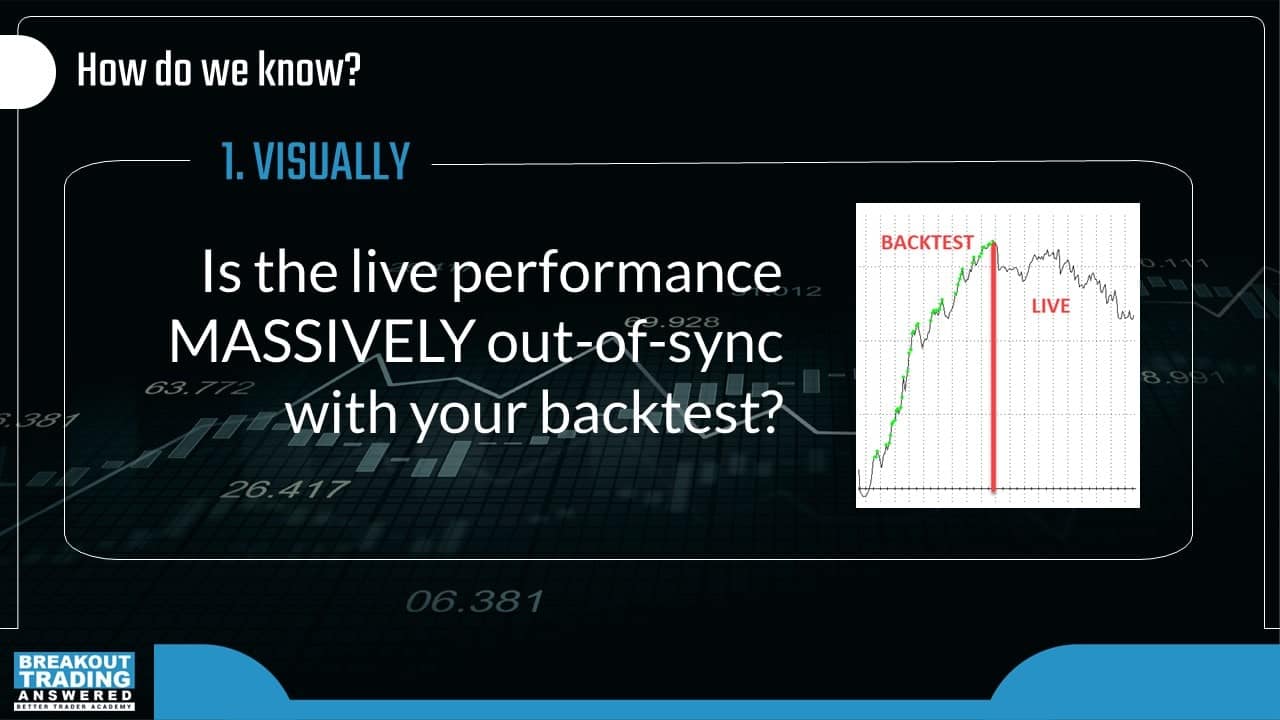
Trading strategy failure is when you create a trading strategy that looks great in a backtest, but… when you trade it live, it performs poorly, often losing money.
Before you smash your keyboard, curse your broker and pull your hair out in frustration, there are 3 steps you need to take:
- Firstly, traders need to understand if a trading strategy is really failing or not. From my own experience, there are many times when we’re in a grey area where it might look like it’s failing, we switch it off and then it recovers and makes a lot of money in a very short period of time. That’s a tough one, so we really need to know whether it’s failing or not.
- We need to understand WHY strategies fail. This is the most important part.
- We need to have a plan for WHAT to do if our strategy starts failing.
So, let’s have a look at three approaches to identify if your strategy is failing.
How to identify a failing trading strategy visually
This first one is simple and very powerful, it’s a visual observation:
In today’s quantitative world, there’s a lot of unnecessary eagerness to have everything precisely quantified.
However, discretionary evaluation still has a role in quantitative trading, especially when you’re constructing portfolios – like when you’re assessing the quality of the portfolio equity curve.
What you’re looking for is a dramatic change in the performance of the strategy over time.
Was the equity curve trending up nicely, either in live trading or a backtest, and it’s now switched direction and heading down into the pits of doom?
Visual analysis is super important because we learn from these visuals. When we look at equity curves, we’re creating cognitive memory in our brain, which can help us later to identify if we feel something might be slightly off.
I still use this technique. Sometimes when we have a chat in our hedge fund about if a strategy is failing, we look at the visual and the picture is so pronounced and radically self-explanatory that we know the strategy is failing without the need to look deeper.
This is such an effective technique – do not underestimate the power of visual assessment.
3 steps to identify a failing trading strategy quantitatively
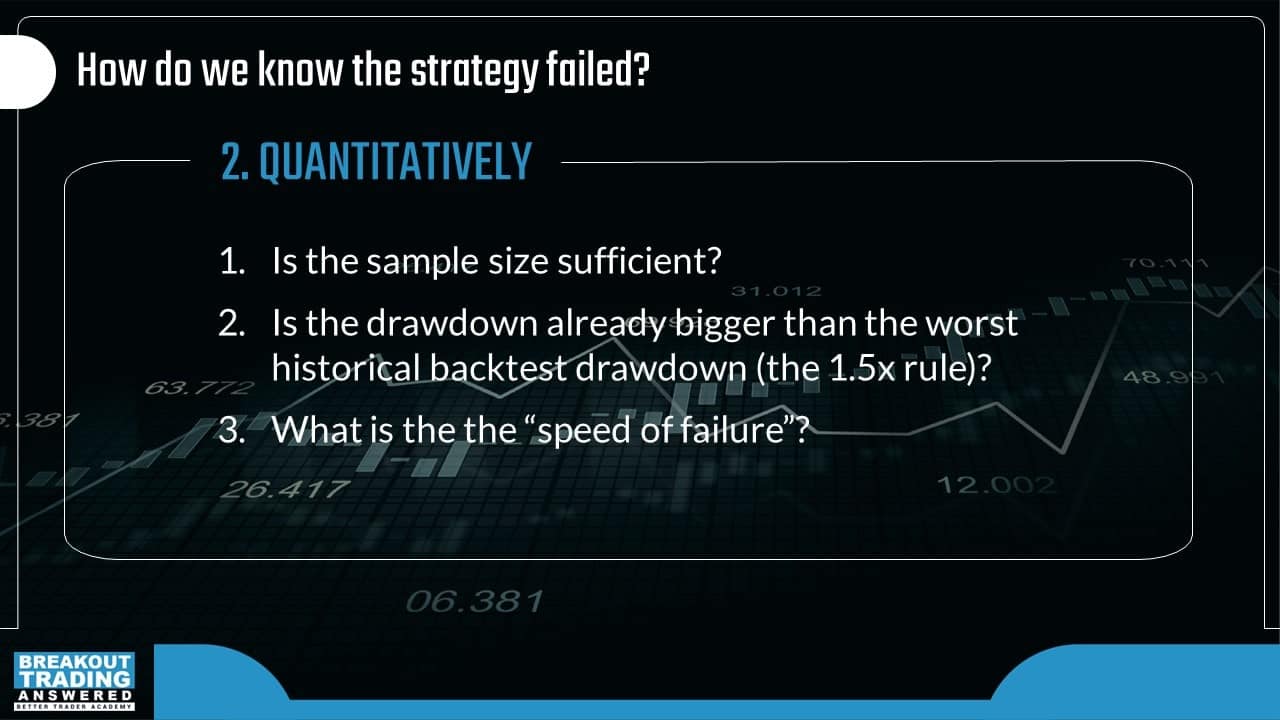
We have a quantitative approach to identifying whether a strategy is failing or not. We could spend hours talking about the many different aspects of this approach, but we’ll keep it simple for now.
Sample Size
The first important thing we need to check is if we have a sufficient sample size to really determine whether it’s a failure or not. 1, 2, 3, 4, 5, or even 10 trades do NOT tell us anything. The minimum statistically valid sample size is 20, at least from my findings. So, whatever is going on, you should have a sample size of at least 20 trades to be able to quantitatively say if a strategy is failing. Sometimes the first 10 trades can produce a steep loss, but then strategy could recover very quickly and on trade number 20 we’re back at new equity highs.
So that’s the first very important quantitative measurement.
Drawdown depth
Now another very basic rule I used for many years was simply if the drawdown was more than 1.5 times larger than the maximum historical drawdown.
So, if my maximum backtest drawdown was $5,000 and the strategy passed a $7,500 drawdown, I would switch it off. This is not the best quantitative approach you can create, but it’s simple.
Speed of failure
A more advanced approach could be to measure the speed of strategy decline, and if the drawdown is happening faster than expected compared to the statistical profile of the strategy, then you know quantitatively you’re probably in trouble.
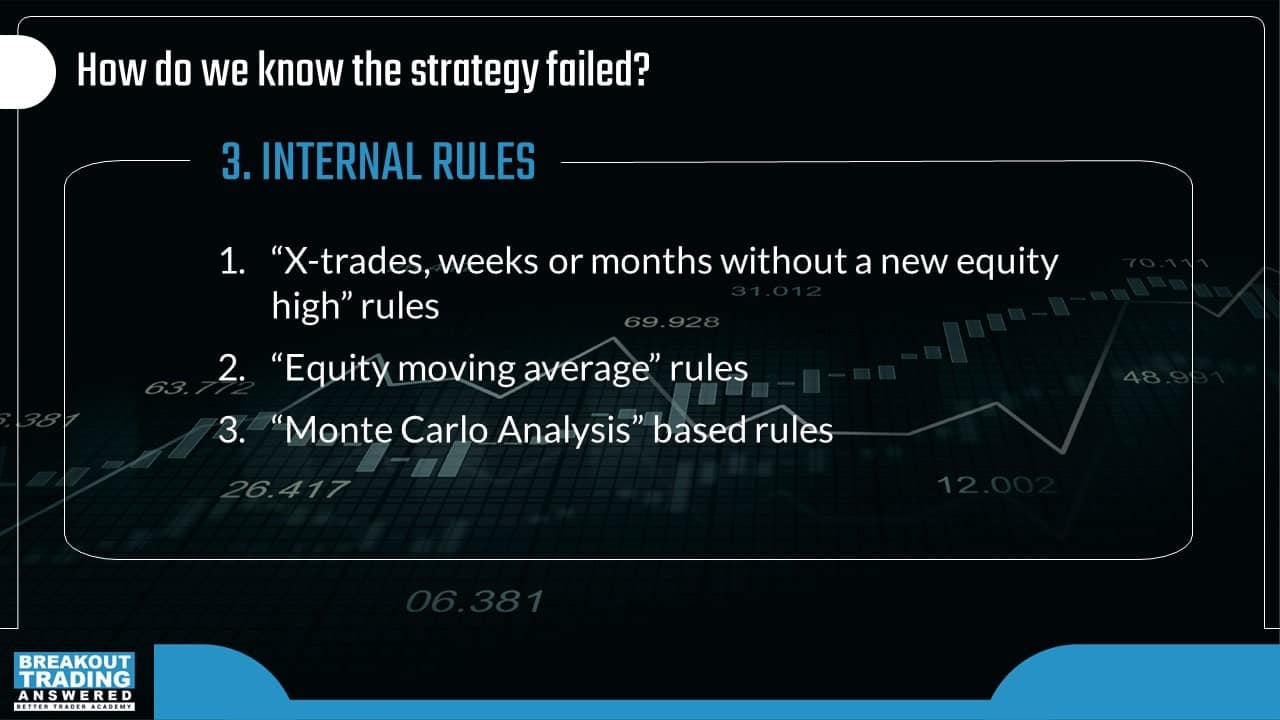
Using “Internal Rules” to identify failed trading strategies
Another approach you could use is what I call internal rules. These can be very individual and often come out of trading experience.
For example, sometimes it can be a simple rule like a specific number of weeks or months without a new equity high. Say you have a day trading strategy that trades very often, and on average you expect that strategy to make a new equity high every 1-2 months. If that strategy hasn’t had an equity high for 3, 4 or 5 months, there’s probably something wrong about it.
So that’s one example of an internal rule.
Another popular internal rule is to use a moving average of the equity curve. I’ve done hundreds of tests on moving averages on an equity curve and it never worked for me, but it might work for a different approach or a different trader.
You can also have some very advanced Monte Carlo Analysis based rules; there are lots of options!
The point is, whatever set of rules you create, you must stick with them. You must not change the rules on the go, because then you create a total mess and things can get significantly worse rather than better.
We will have occasions where these rules prevent us from recovery or other rules would have given us better results than the rules that we have chosen. The truth is that we chose these rules for a specific reason. We spent time thinking about them and we know why we deployed them, so we must stick with them when drawdown happens. If you want to review the rules later, then that’s ok, but changing them in the middle of a drawdown may not be the best approach.
3 reasons trading strategies fail and how to fix them
There are basically three main reasons why strategies fail.
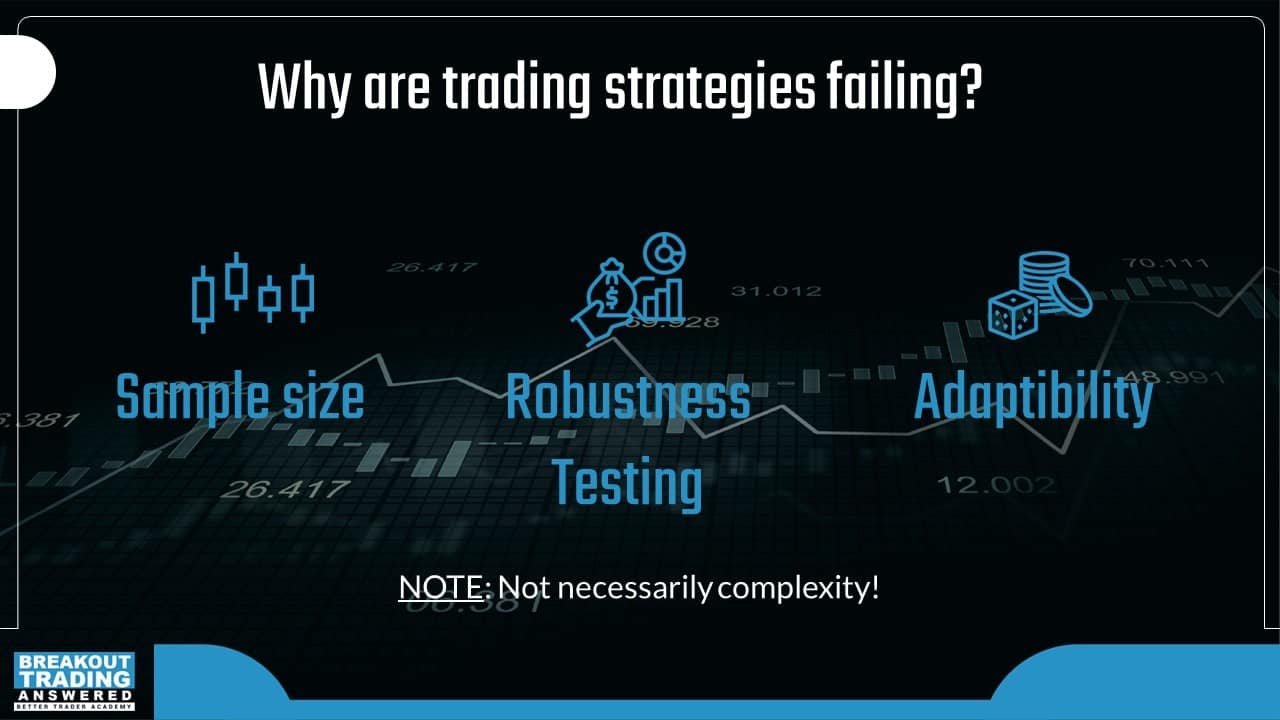
Sample size
The first one is sample size.
This can be something that traders are stubborn about because they don’t understand it correctly. Let me give you an example.
About a year ago I had a chat with trader who was insisting on the idea that he only creates strategies using the last year of data, because that’s the closest to what’s happening in the actual market right now.
There’s some merit in that idea, I cannot deny that. But what this trader was forgetting was that in just 2 months, the markets can completely change. Perhaps the last year was a bull market and now the market has switched to a bear trend. Or perhaps just a few months ago volatility was low, and that quickly changed to a high environment. Or maybe a war has broken out, which changed the mood of the market. Of the Fed made an announcement. There are so many things that can change the market environment in a short amount of time. Either way, now that trader is trading a strategy that may not have been covered in the scenario he originally tested, which can have a severe impact on strategy performance.
There’s only answer for this: you need to create strategies on a large sample size. At least 10 years of historical data to really cover all the scenarios because whatever is going to happen next, there is a bigger probability that it was covered in one of these 10 years, rather than the last year only.
And then statistically, a good sample size to know that you have an edge is at least a couple of hundred trades. If you see a strategy that’s profitable over 500+ trades or more, that gives us a lot of confidence that we covered all the different scenarios – volatility, trends, and anything else.
Robustness testing
The second one is probably the most common – robustness testing.
I still can’t believe how many times I see traders create a strategy and they put very little effort into robustness testing procedures. They focus on entries, indicators and optimization, but neglect robustness testing. They cheat on their robustness testing procedures chasing a vision of a steadily rising equity curve, but it doesn’t work that way.
Robustness testing is the MOST important part of the development process.
In my breakout trading process, the robustness testing procedures are very tough and are the biggest part of strategy development
Whatever robustness testing procedures you’re using today, step them up. Make them tougher (or use my breakout trading framework which has some of the toughest robustness tests in the industry).
Adaptability
Adaptability is another important factor traders need to consider.
Markets keep changing and your strategies need to be able to adapt to changing market conditions.
There are a number of effective ways to increase adaptability in trading systems.
The first one is to add an adaptive element directly into the strategy.
It can be something as simple as an Average True Range (ATR), which is one of my most favourite indicators because it can change with volatility. I always use ATR in my breakout strategies because it is highly adaptable and continues to work.
Or you can use something fancier like auto-adaptive indicators. This is quite a difficult job to create them, but it is possible.
Another way to add adaptability is through trade management, like my Dynamic Profit Taking solution (https://dpstradingtechnique.com), which adjusts exits based on market conditions as they change.
Or traders can add adaptability by using use reoptimization to regularly update your strategies.
There are many different ways to add adaptability, each with the pros and cons, so I recommend testing them all to see what works for you.
I’ve found a combination of these approaches can be very powerful.
Do complex trading strategies always fail?
A lot of traders believe super simple strategies are better than more complex strategies and strategies fail because they’re too complex.
Is this actually true?
A few years ago, my Hedge Fund team and I spent a lot of time researching this idea that simple strategies are more robust and could never prove that simpler strategies were any better than more complicated strategies.
We compared the results of almost 1000 trading strategies with between one and seven optimizable inputs, and we found no evidence that strategies with very few optimizable inputs were any better than strategies with 5, 6 or 7 optimizable inputs.
It’s often stated that the less inputs you have the less curve fit a strategy can be, however, it’s still possible to overfit a strategy with just one input.
In fact, having less input parameters makes it more difficult for a simple strategy to adapt to changing market conditions more than being able to use multiple parameters.
There’s no evidence from my research that a simple strategy would outperform more complex strategies or that complex strategies are less robust than simple ones.
What to do when a trading strategy fails
When a strategy fails, there are 3 actions you should take.
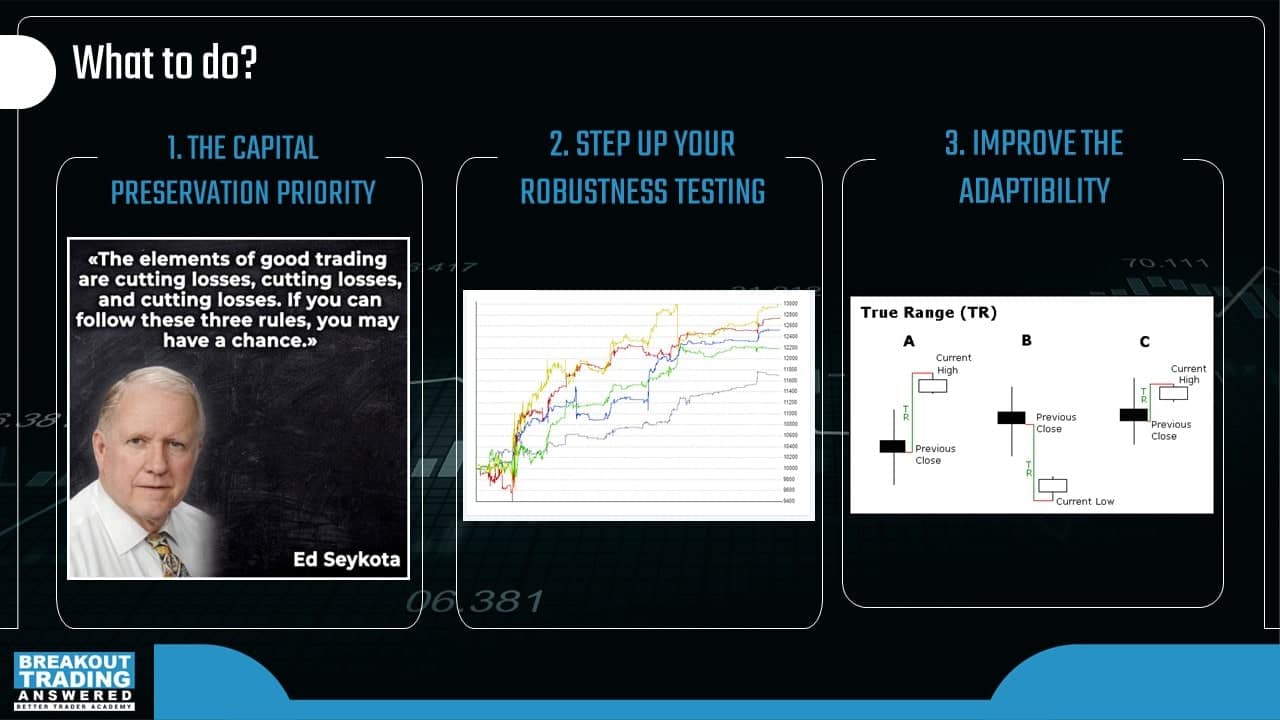
Capital Preservation
When a strategy fails, the very first thing you must think about is your capital. The number one rule is capital preservation. It is always the highest priority.
Many years ago, I switched off a strategy which went sideways. And even although it recovered later on, I did not regret it because I preserved my capital from the noise and nonsense and used my capital to deploy strategies which actually made money.
Ed Seykota, one of my favourite traders of all time says “the elements of good trading are cutting losses, cutting losses, and cutting losses. If you can follow these three rules, you may have a chance” and I think that’s genius. It’s so simple and so true.
So don’t be stubborn. Capital preservation is the highest priority always. There’s no harm in switching a strategy off when it goes beyond your risk profile.
Step up your robustness testing
The next one is step up your robustness testing. Whatever it is, think how you can make it even harder, take it like a challenge. It’s like people who do these crazy workouts like CrossFit. They like pushing further, working out harder. Who will create the next challenge and who will beat that challenge. It’s the same with robust nesting procedures, think how you can push it further and make it even harder on your strategies. You’ll never regret this. This will be your biggest payoff.
Improve Adaptability
To improve adaptability, consider how to incorporate an adaptable element in your trading strategies. Indicators with adaptability, for example, Average True Range work fantastic in breakout trading. It’s a simple, yet effective tool to improve adaptability and therefore the robustness of your strategies. It can even mitigate a lot of situations where you have to suffer failing strategies.
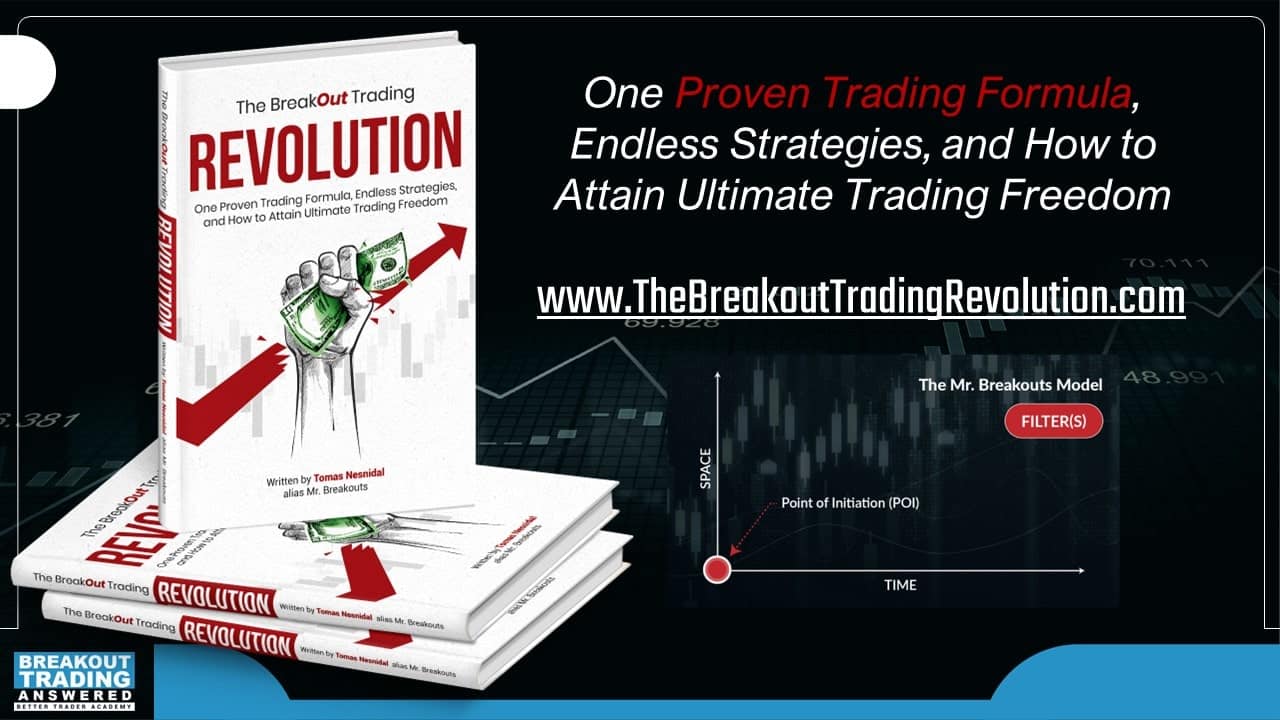
How to build breakout trading strategies
If you want to learn more about the breakout trading model hundreds of traders are now using and how you can too, grab your copy of the Breakout Trading Revolution book (plus a bunch of awesome bonuses) at: https://thebreakouttradingrevolution.com
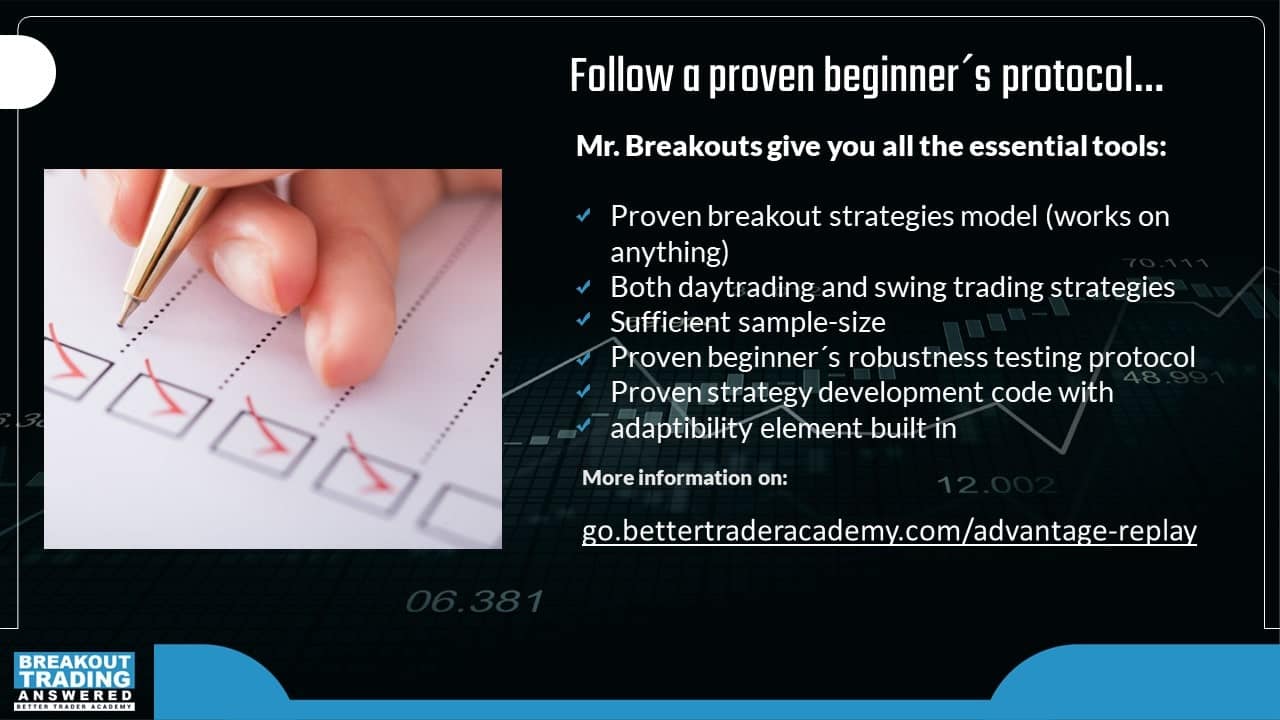
Or if you want to get straight into building breakout strategies today, check out: https://go.bettertraderacademy.com/advantage-replay
Learning from failed trading strategies
A common question traders wonder is what to do with a strategy after it has failed and been turned off. Should you ever go back to it again later to see how it’s performed?
This may surprise some traders, but I do keep monitoring failed strategies because it’s one of the greatest learning experiences.
I want to see if they recover. If they do recover, how fast was the recovery and under what circumstances? Why did the strategy recover now and not before?
It really improves your understanding of the markets and dramatically increases your speed of learning. In our Hedge Fund, we keep all the failed strategies in our database and are still learning from them. We are assessing them separately, to learn as much as possible. There’s a great opportunity to learn just from failing strategies.
But what if a failed strategy has recovered? Should you ever switch it back on?
Personally, I usually do not go back to trading it.
With some strategies, I have modified them a little bit and switched on the updated version, but only if the updated version had some additional element. It still kept the same core trading idea, but there could be some brand new element in it. So, it was like trading strategy version two or version three.
I don’t do that anymore because we have so many strategies in my Hedge Fund database that we can replace a failed strategy immediately.
Sometimes traders can fall in love with their strategies and build an emotional attachment to them, and when a strategy fails, they take it personally. They’re disappointed, frustrated or upset, when the strategies fail.
Try to turn this behaviour around by seeing it as a positive experience, and opportunity to learn. It’s actually a good thing because you can improve your trading by observing these failed strategies, analysing why they failed and identifying ways to improve them.
Do not be embarrassed by trading strategy failures.
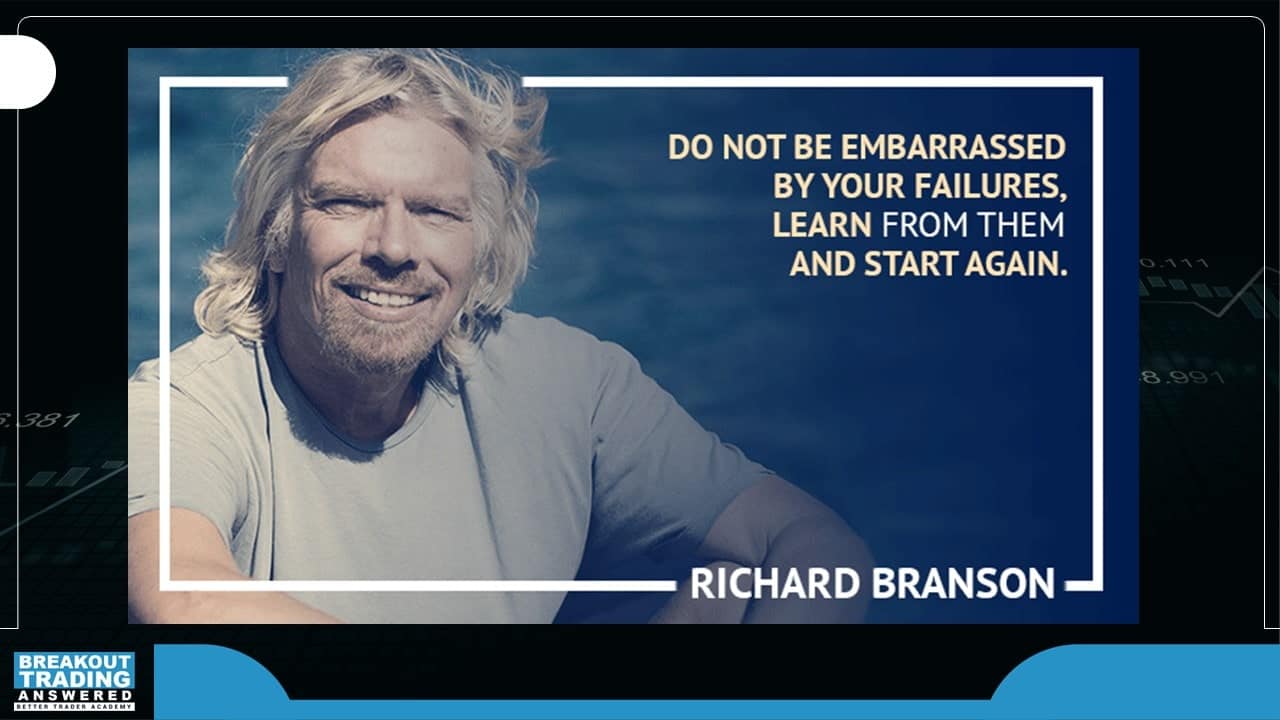
If we have failing strategies, that means we still have more to learn. Successful traders usually find they learnt the most from their failing strategies, not the winning strategies.
And that’s a good thing.
Learn from them and start again.
Watch the replay
Watch the live show replay where algorithmic Breakout Trading Specialists Tomas Nesnidal and Andrew Swanscott discuss “How to Stop Losing Money Trading: FAILING STRATEGIES”, including:
- The impact of failed trading strategies
- 3 ways to identify a failed trading strategy
- How to gain experience identifying failed strategies without the losses
- How to measure speed of failure to detect strategy failure,
- 3 reasons trading strategies fail and how to fix them
- What to do when a trading strategy fails
- Learning from failed trading strategies
- Plus stress-testing, adaptive trading strategies, strategy complexity and much more.