With all the indexes we have to choose to trade, which one is the best for trading?
What about in Bull markets or Bear markets?
Does it even matter?
That’s exactly what we’re going to discuss in this episode.
Are all indexes the same?
Some traders might think “Indexes are all the same. They go up and down at the same time. They all have a long bias. Why does it matter which one we pick? Does it even matter?”
I used to think that too. I used to think all indexes were the same. I used to think they all had a long bias, until I did the analysis and let the numbers speak for themselves…
And I found a shocking change in index markets that I think many people are still not aware of.
I’m going to share it with you now because it’s something new and it blew my mind.
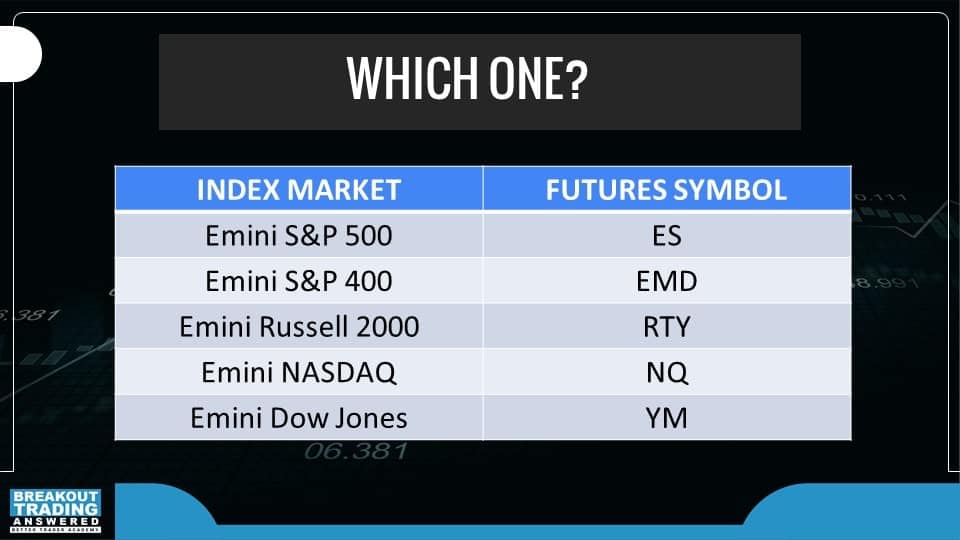
Before we jump into the analysis, let’s see which index markets are available to trade and which ones we’ll be analyzing:
As you already know, we’re all about the numbers.
The data tells us the truth.
We always make our decision based on data, not based on hype.
So what does the data tell us about indexes?
Long-term bias of indexes
First, let’s look at the long-term characteristics of indexes over the last 15 years.
I did some very simple analysis on indexes by simulating what would happen if you bought the open every day and exited on the close of every day.
If you do a simulation like this, you can get a pretty good idea of how much opportunity the market provides, based on average trade, and what the market tendency is, based on whether the average trade is positive or negative.
Here’s what that analysis of indexes looks like over last 15 years:
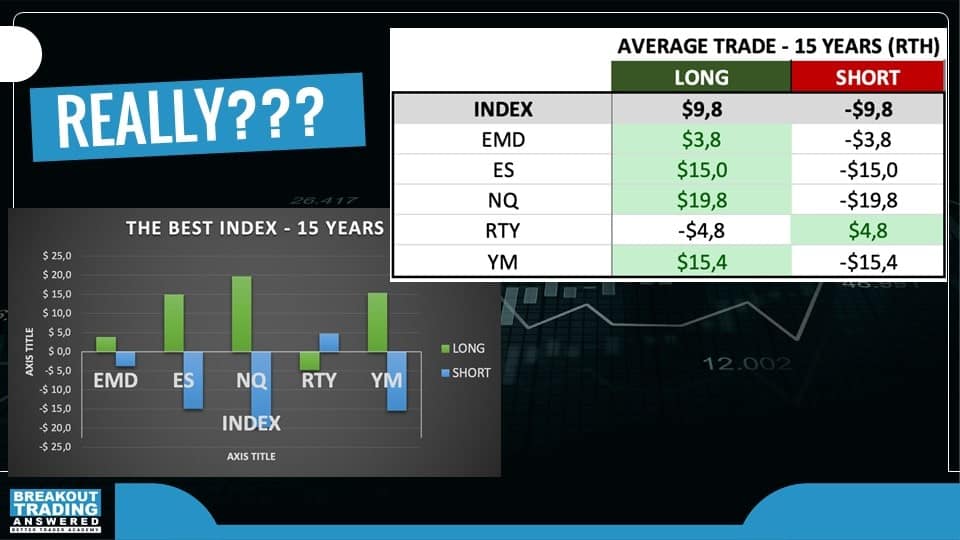
From the chart above, we can see that over the last 15 years, if you bought the S&P500 (ES) on the open and sold on the close, you would get an average trade of $15.
Now this absolute number is not that important, although we will use it a little bit later in this article.
What we can also see here is that there is a long bias because if we did do the same thing on the short side, selling short on the open and exiting at the end of the day, we would end up with minus $15.00 average trade.
Now what’s interesting is if we do this across all these five indices, what we can immediately see is one market has never actually had a long bias – the Russell 2000.
Now go figure, this really surprised me. I expected Russell to be biased to the long side like any other index, but this is what the data says.
So, it’s not true that all of the indexes are long biased, which is very interesting.
If you think about it, what is the one of the biggest challenges for index traders?
Shorting Index Markets
Traders often struggle with short strategies on indexes. We can make a lot of money when index markets are going up, however it’s a different story during a bear market. It’s possible to create short strategies on indexes but getting a large enough sample size can be challenging.
Now you see, just based on this very simple analysis, we have a potential solution; we can complement Long bias market like ES or NQ with Short bias market like RTY. We can try to create short strategies on RTY.
Now it’s never so easy in trading because we need to focus not only on long-term tendencies, but we also need to see if something has changed recently. That’s why I always compliment any longer-term analysis with shorter term too. I like to use 3 years of data for short-term analysis, because it gives us good of a sample size or around about thousand trades.
When I finished this short-term analysis, I was totally blown away.
Short-term index market tendencies
So not only is it untrue that all indexes are long biased, but now we see two heavily short bias indexes – EMD and RTY.
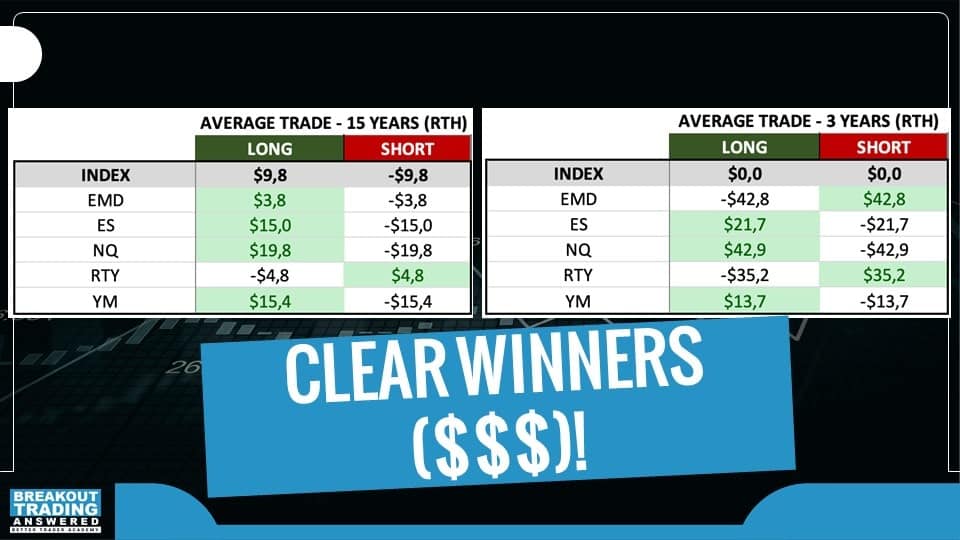
This is surprising because EMD and ES are similar markets, so I was expecting them to give similar results, but from this data we can see that EMD has got really bearish in the last three years.
So again, surprise, surprise, surprise.
First of all, not all the indices are bullish.
Second, now we have two markets to construct better short strategies on and I think that’s amazing news.
There are other things we can read from this chart too:
- ES is not only stable in its longer-term tendency, but the average trade is increasing in the short-term because volatility is increasing. I would perhaps expect a little bit higher average trade, around $25-30 because volatility has doubled, but $21.7 is a fair number and it shows stability.
- We can see a very good improvement in NQ too. NASDAQ obviously keeps its bull trend, and we all know that the volatility is crazy in NASDAQ compared to what it used to be. So again, a very fair number reflecting the reality we’re seeing in the markets.
- What shocked me was the volatility in YM has dropped. I did not expect this. I would expect that the average trade of YM increased over the last three years, however it’s lower. So, we’re getting less volatility in YM and it means that maybe it’s harder to make money in YM than it used to be. And I think some traders confirm that, however YM is not a bad market. I like YM, I still have it in my portfolio.
The best index to trade in 2023
Now that we’ve completed the data crunching analysis and have selected either ES or NQ as the best candidates, we need to also look at the fundamentals underlying the characteristic of that market.
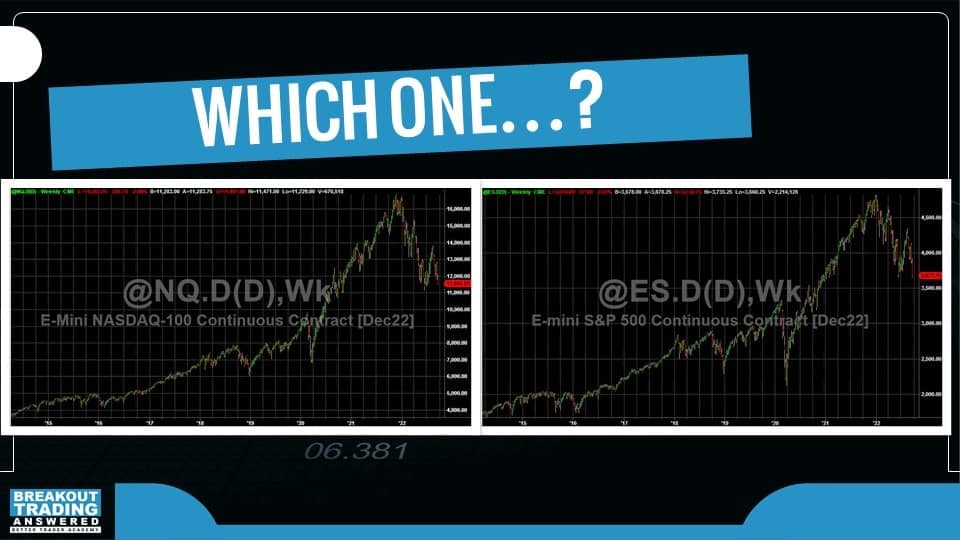
What is it that drives this market? What’s fundamentally different between these markets?
The difference is that NASDAQ is a technology index. Tech has driven a lot of the moves in the last 7-10 years, but recently we’re seeing Technology companies are doing the fastest.
They’re dropping faster than other companies, and I think we’re still dealing with a Tech bubble in the NASDAQ, which could be reverting to its Mean. Whereas with the S&P 500, we’re trading in 500 major companies which now behave in a similar way to how they behaved 10 or 15 years ago.
So, my pick would be S&P 500 (ES) because my gut is that NASDAQ is reverting. We will see less of a bull trend, and more of a correction – which is happening already.
But market selection is just one piece of the puzzle. What about trading style?
The best index trading style for 2023
Here are 2 strategies I pulled out of my strategy database. These are breakout strategies based on the breakout model I presented in my book, the breakout trading revolution (https://thebreakouttradingrevolution.com).
This strategy is a daytrading strategy on ES:
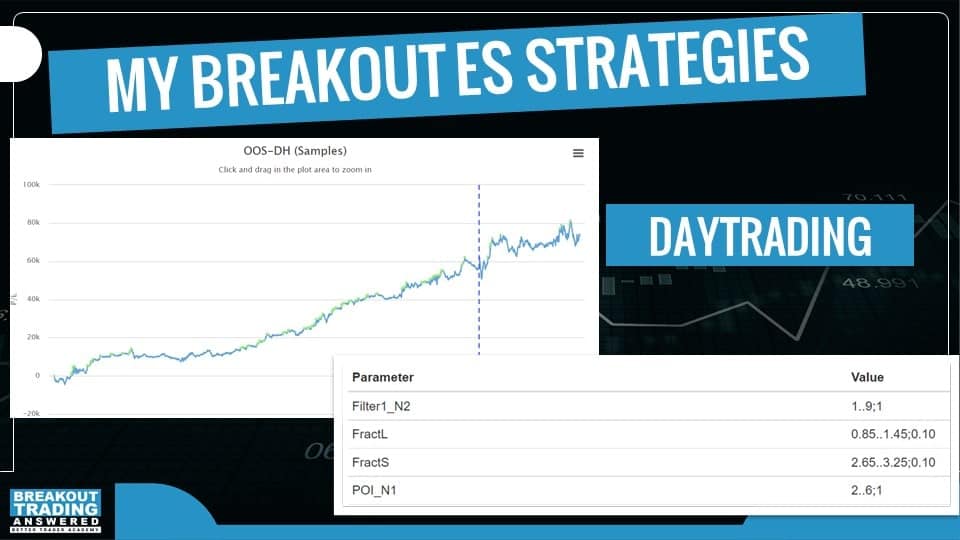
One observation I have about the S&P index is it’s getting harder to build and trade day trading strategies. In this example, you can see that the true out sample period (to the right of the vertical line) is not as smooth as the in-sample period (left of the vertical line).
Whereas in this next example, we can see this swing strategy is quite stable to the right of the vertical line. The results are more consistent and predictable.
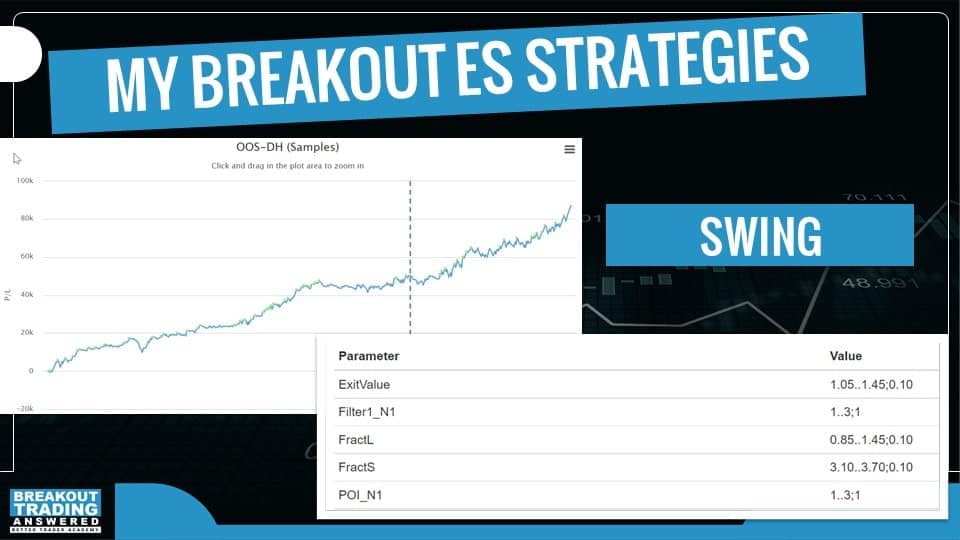
So, my final advice for 2023 for index trading is that ES would be a good pick, plus if you focus on swing strategies over daytrading strategies, you’re like will be a little bit easier and there’s a good chance that you will see better stability in real trading as well.
So that would be my final advice regarding selecting the best index market and trading style for 2023.
Discover more Index Trading tips
Want to go deeper with your index trading?
In a few weeks’ time we’re running the Index Mastery workshop where we will go even deeper into index markets, and I will present things that I guarantee you have not seen before.
It will be very data driven. Everything will be very provable, and practical to implement.
If you’re interested, go to https://go-bta.com/indexes, and submit your email so we can let you know when it’s ready.
November is Index Mastery month, with lots of data, charts, and alot of interesting mind-blowing stuff that will help you tremendously to improve your index breakout strategies.
Make sure you subscribe to the BTA youtube channel so you don’t miss it.
Watch the replay
With all the indexes available to trade, which one is best? Does it even matter? And which index market is best for shorting in a bear market?
On this episode of Breakout Trading Answered, algorithmic breakout trading specialists Tomas Nesnidal and Andrew Swanscott discuss the “Best Index To Trade”, including:
- Why it’s important to select the best index market,
- Individual tendencies of index markets and why not all are the same,
- The only index market with a long-term short bias,
- The 2 best indexes to short in a bear market,
- Most stable index for trading,
- Why EMD is difficult to trade,
- The best index trading style for 2023,
- Plus much more.
Episode Highlights:
[00:00] Introduction
[01:35] Why selecting the best index matters
[04:00] Which indexes are available to traders
[06:00] Index analysis to determine individual tendencies
[08:00] The only index market with a long-term short bias
[11:30] The 2 best indexes to short in a bear market
[16:15] Most stable index for trading
[19:12] Is EMD a good market to trade?
[22:30] The best index trading style for 2023
[26:00] Index Mastery workshop
Released: November 15, 2022